You can SQL your logs in Grafana
Most people don’t know that Grafana can join log queries using SQL.
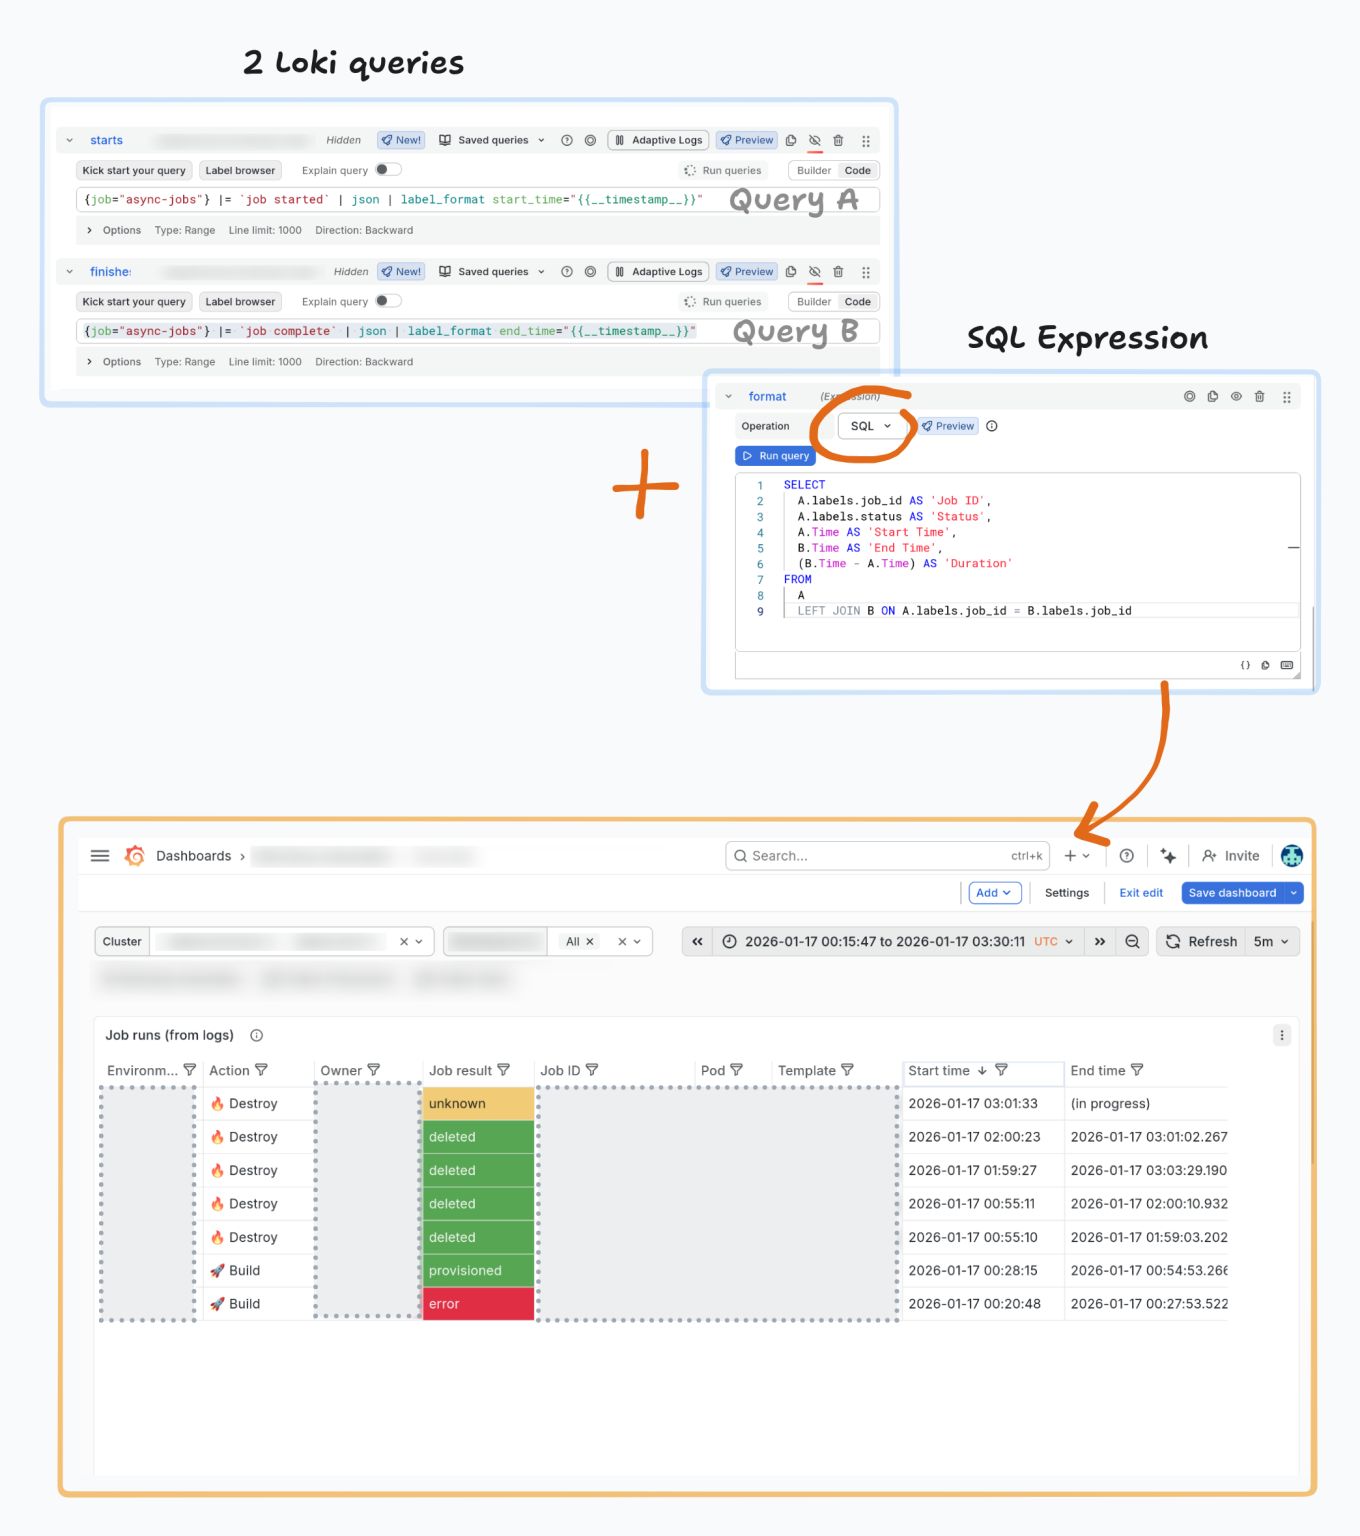
In my team, we manage a system that runs asynchronous jobs, each writing two log lines - one at the start, one on completion. How do you track job progress without creating a database?
Turns out, Grafana can do it.
The Pattern: Write two Loki queries (to find the “start” and “end” lines), then use Grafana’s SQL Expressions to join them on job_id.
The Result: A full job state table! See start time, end time, duration, or status – all from logs, and no database required.
I shared this with someone, and they immediately went off to build their own dashboard. :)
Add Data Links (contextual links to relevant log queries) and you’ve got a custom job monitoring tool with zero infrastructure.
I really like this feature. Same pattern works for any async workload that produces logs: CI/CD runs, batch jobs, ETL processes, anything you like.