Monitoring my blog with Grafana's free tier
I think personal projects deserve just as much monitoring love as much as production systems.
So, I built a monitoring dashboard for my personal blog at the weekend, using Grafana Cloud’s free tier.
I’m tracking request rates, errors, top URLs and 404s, all from NGINX access logs in Loki.
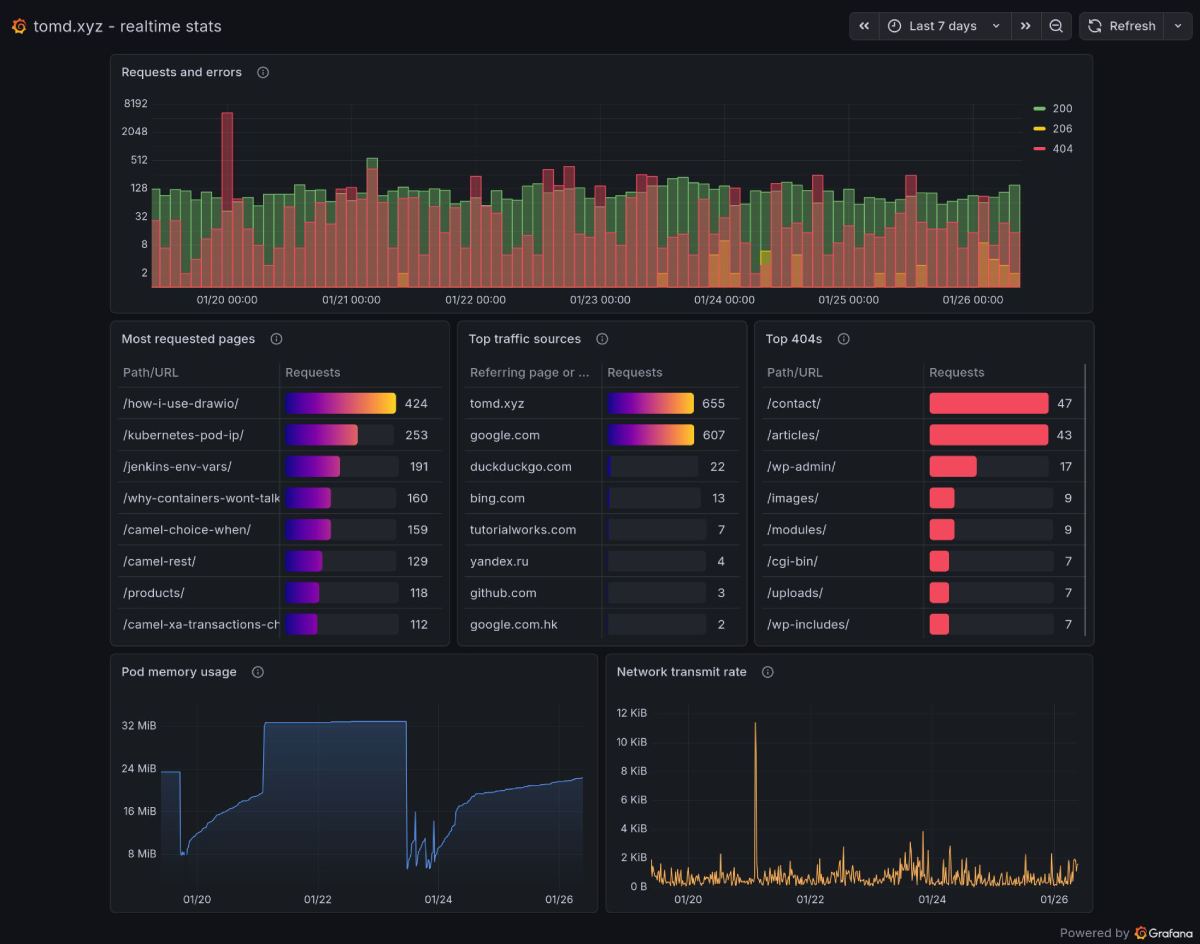
Loki’s pattern parser handles the NGINX log format in real time, no pre-processing required. Then I wrap the results with count_over_time() or topk(), to get the metrics I need.
I’ve also added pod memory and network bandwidth from Kubernetes metrics, so that I know if the server’s struggling, or if I’m going to be hit with an egregious bill from Hetzner for data transfer.
Whole thing fits in the free tier, definitely doable as a weekend project!