Monitoring Camel routes with REST
Can you monitor Camel routes using REST? Sure!
Camel quite helpfully collects a bunch of really useful metrics on your routes and endpoints, including things like:
- number of exchanges processed
- number of failed exchanges
- uptime
- and so on..
By default, Camel makes these metrics available using Java’s native monitoring and management API - Java Management Extensions (JMX).
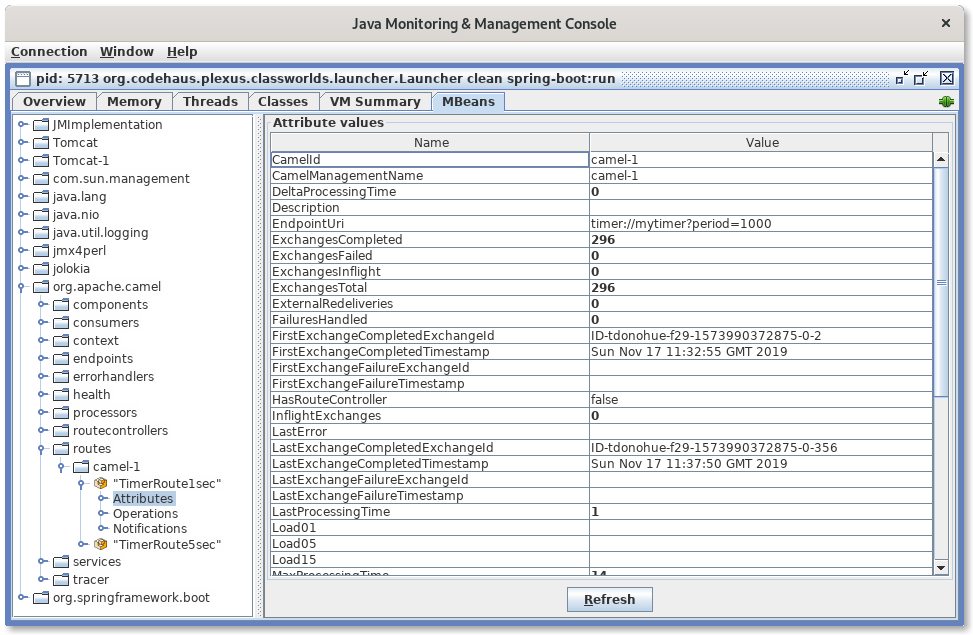
If you want to access these metrics, you’d normally need to use a client which can browse JMX objects (e.g. a desktop tool like JConsole, which is included with the JRE), or maybe write your own code to fetch metrics using JMX.
Here’s me browsing Camel MBeans in jconsole:

Exposing Camel metrics over HTTP with Jolokia
But what if you don’t want to use JMX? Or you want to easily fetch metrics over HTTP?
You can get these stats over HTTP, if you use a tool called Jolokia.

Jolokia is a tool which can be added to almost any Java application, not just Camel apps. It simply takes your JMX MBeans (the things that expose your metrics, or allow you to manage your application) and exposes them over HTTP.
So to check the status of your Camel routes using simple HTTP requests, just add Jolokia to your Camel app. Here’s what you need to do to set it up.
Example - monitoring Camel routes using Jolokia
To monitor Camel routes using a Spring Boot 2.x application, start by adding Spring Boot’s Actuator if you haven’t already. Actuator is a component in Spring Boot which provides a bunch of production-ready features. Actuator also has nice support for Jolokia and will configure it for you!
Firstly, you need to add these dependencies to your POM:
<dependency>
    <groupId>org.springframework.boot</groupId>
    <artifactId>spring-boot-starter-actuator</artifactId>
</dependency>
<dependency>
    <groupId>org.jolokia</groupId>
    <artifactId>jolokia-core</artifactId>
</dependency>
Now your can start your Spring Boot 2.x app:
mvn clean spring-boot:run
Then you can just use curl (or your favourite HTTP client!) to query Jolokia and fetch back some useful info.
For example, this Jolokia URL will return all available stats from all routes in your Camel Contexts as a JSON object:
http://localhost:8080/actuator/jolokia/read/org.apache.camel:context=*,type=routes,name=*
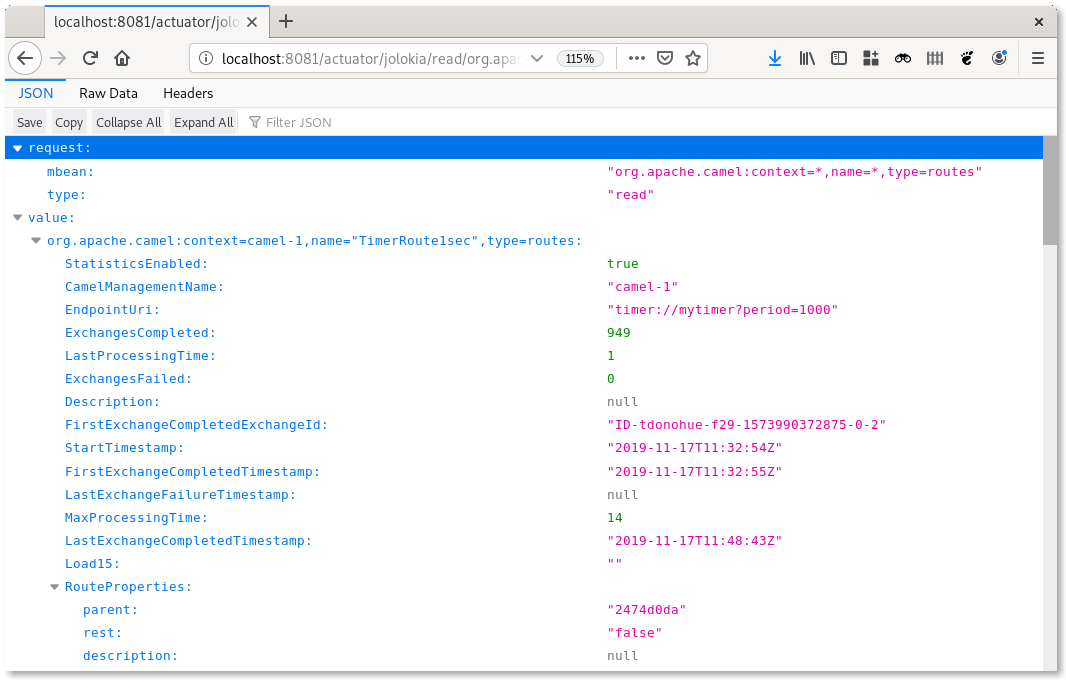
If you view it in Firefox (and add ?mimeType=application/json to the URL), you’ll get a nice pretty-printed version, like this:

Or you can fetch the same JSON using cURL:
$ curl http://localhost:8080/actuator/jolokia/read/org.apache.camel:context\=\*,type\=routes,name\=\*
This will give you your Camel route metrics as JSON, which you can use however you like:
{
  "request": {
    "mbean": "org.apache.camel:context=*,name=*,type=routes",
    "type": "read"
  },
  "value": {
    "org.apache.camel:context=camel-1,name=\"TimerRoute1sec\",type=routes": {
      "StatisticsEnabled": true,
      "CamelManagementName": "camel-1",
      "EndpointUri": "timer://mytimer?period=1000",
      "ExchangesCompleted": 2162
  },
  "org.apache.camel:context=camel-1,name=\"TimerRoute5sec\",type=routes": {
    "StatisticsEnabled": true,
    "CamelManagementName": "camel-1",
    "EndpointUri": "timer://mytimer2?period=5000",
    "ExchangesCompleted": 433
  },
  "timestamp": 1573983712,
  "status": 200
}
More ideas for Jolokia
Making it even prettier: If you want nice output when you’re using curl, you can pipe the output from curl into the jq command. This will pretty-print and syntax-highlight the output! Ahhh, bliss!
Using Jolokia in production: Jolokia also has some features to secure its interface and deny access to specific JMX MBeans. This is a bit beyond the scope of what I can cover in this article, so do check out the Jolokia docs before you decide to run it in production.